Yeasts close-up, imaged in a well-plate in an automated manner using a scanR high-content screening system equipped with spinning disk microscope technology and a 40X XAPO air objective lens (NA 0.95). The original camera frames captured by the microscope are four times bigger. The yeasts are ca 5 μm in diameter. Red and green signals are organelle probabilities, rendered from pre-trained AI networks built within the scanR software.
scanR is empowering researchers to create, discover, and accomplish more than ever before.
At Evident, innovation isn't just about building new tools—it's about enabling a future where scientists and clinicians can break barriers, uncover what was once invisible, and make meaningful progress in health, biology, and technology.
Our recently updated scanR high-content screening system, version 3.6, stands at the forefront of that mission. To learn more, we sat down with Dr. Manoel Veiga, application specialist at Evident and one of the minds behind the latest iteration of scanR.
What followed was a wide-ranging and insightful conversation about the future of imaging, artificial intelligence, and discovery at scale.
Building Platforms That Push the Boundaries of Scientific Discovery
Q: Manoel, let’s start with the basics. What does “creating” mean in the context of scanR version 3.6?
Dr. Veiga: At Evident, "creating" is about providing researchers with a platform that goes beyond image collection—it’s about facilitating the creation of real knowledge. Whether it’s developing a full new assay from scratch, or a new AI model to improve an already established assay, scanR acts as a launchpad for scientific innovation.
Let’s go over a couple of past and recent examples. More than one decade ago, researchers who were inspired in the image cytometry interface of scanR developed a full acquisition and analysis pipeline coined “Quantitative Image-Based Cytometry.” This effort led to a number of high impact papers in cancer research.1 Scatterplots of thousands of single nuclei, plotting DNA content against specific protein markers, helped elucidate biological mechanisms and pathways involved in drug response.
Just this year in 2025, a researcher using the AI and cytometry capabilities of scanR developed a workflow that they named “Quantitative AI-based DNA fiber workflow.” This process studied the replication stress in an automated manner by surveying individual DNA fibers imaged by the microscope.2 The DNA fiber analysis already existed, but it relied exclusively on manual image acquisition and analysis, making it time-consuming and susceptible to user bias. The new AI-based DNA fiber (qAID) workflow enables imaging and multiparameter analysis of thousands of DNA fibers within several dozen minutes.
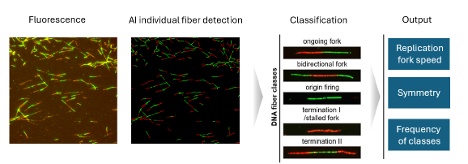
Steps in the automated imaging analysis of DNA fibers using the scanR high-content screening system.
These examples show that when researchers acquire a scanR system, they are not just buying a microscope. They are achieving real results.
Q: What sets scanR 3.6 apart from earlier versions?
Dr. Veiga: The most significant change is that scanR version 3.6 works with the IXplore™ IX85 platform—a motorized inverted microscope with an industry-leading field number of 26.5 mm for an unparalleled field of view. The single camera frames are now larger as well, leading to better statistics: 50% more cells per image; and faster scans, as you don’t need to collect as many images as before to achieve the same cell statistics.
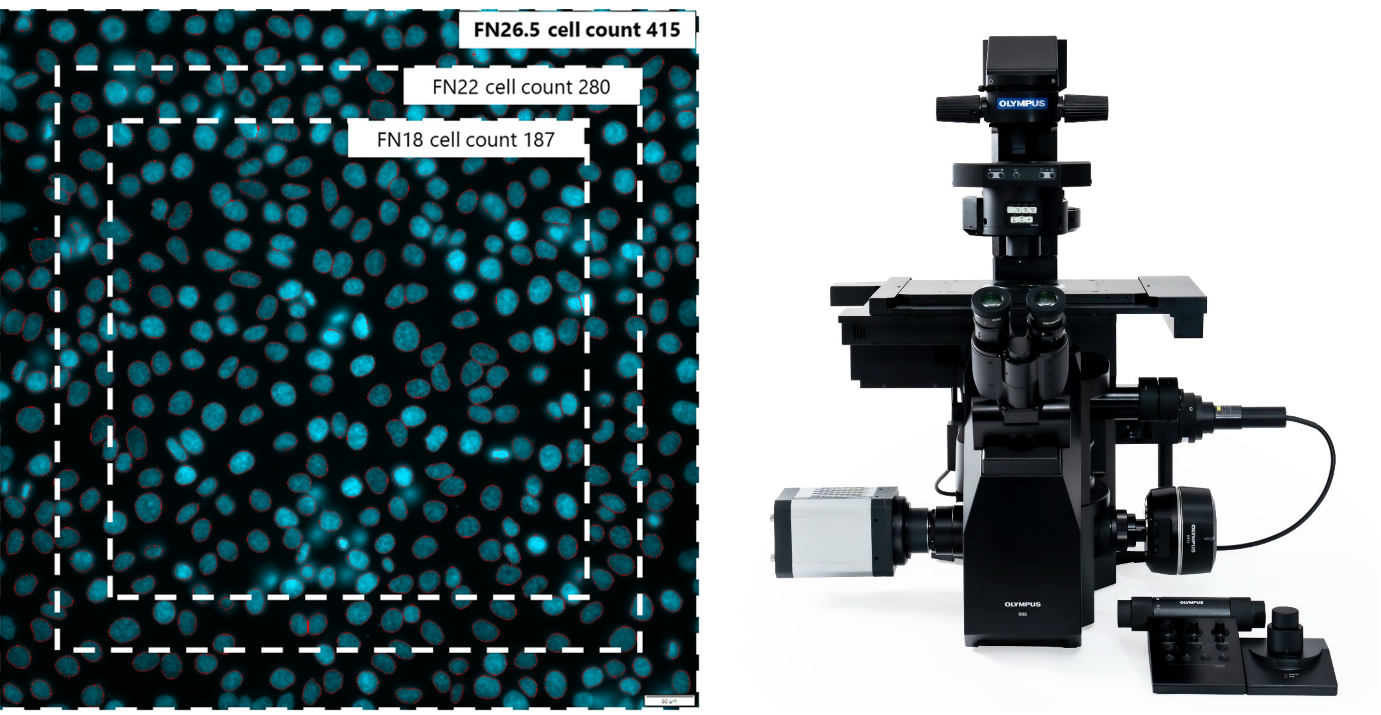
Left: Increasing the field number increases the cell count. Right: IXplore IX85 motorized inverted microscope platform.
Apart from the new IX85 platform, we now support a wider variety of spinning disk configurations. In addition to the CSU-W1 from Yokogawa that supports super-resolution imaging in its SoRa version, we now have integrated Crest X-Light V3 with a special coupling design to maximize the large field of view of the IX85.
It is important to mention that not only hardware contributes to faster results.
The overall software workflow is just as important:
- 1.Great hardware will not make scans faster if users spend a long time setting up acquisition experiments. scanR can start acquisition experiments with just a few clicks within the software, while keeping all cells in focus.
- Overall speed is accelerated by parallel acquisition and analysis. We have received feedback from users indicating that tasks which previously took weeks or even months can now be completed significantly faster—sometimes in just a few hours.
Q: AI seems to be playing a larger role in scanR version 3.6. How does it enhance the system?
Dr. Veiga: Most of the analysis assays rely on the same sequence:
1) Segmentation of objects.
2) Extraction of the features of those objects.
3) Classification of single cells according to those extracted features.
4) And obtaining an accurate population percentage of each cell type against treatments.
The better you can segment those objects, the higher the quality of the results. The reason is that intensity and shape factors are extracted very precisely, and subsequent cell classifications are more reliable. So, if you can segment precisely what you want, you can perform a broad range of analyses tailored to various imaging applications.
In the past, users needed a lot of experience in image processing to segment selectively only the specific structures of interest. Fortunately, segmentation is now easy with AI, a tool that significantly simplifies the assays. scanR version 3.6 comes with five pre-trained networks—nuclei, cells, spots, structure, and nuclei in transmission—that help users with the most common analysis tasks.
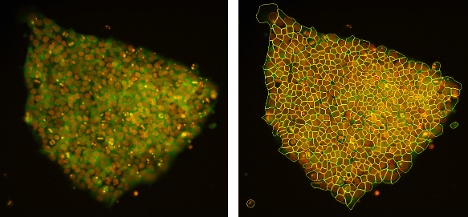
Pluripotent stem cells acquired with a scanR widefield microscope. An AI pretrained cell segmentation model applied in the green channel is shown in yellow, while an AI pretrained nuclei segmentation model applied to the orange channel is shown in red.
Apart from those, users can apply an AI training module to develop their own algorithms to segment specific structures without the need for computer coding skills. Whether this task is finding chromosome bridges during mitosis, analyzing distinct interaction of cells in a time-lapse, or identifying a particular fluorescence distribution pattern within a cell, AI takes it to a level of sophistication we couldn’t have achieved otherwise.
Finally, scanR classification and AI tools can also be used to quickly identify and re-image cells or structures of interest at high resolution by applying the rescan from the region function.
Illuminating the Unseen: Making the Invisible Visible
Q: Evident’s focus is on "illuminating the unseen" to push the limits of scientific discovery. What does that mean for researchers using scanR?
Dr. Veiga: "Illuminating the unseen" is about revealing the complexity and richness of biological systems that traditional imaging techniques often miss. For decades, microscopy meant observing only what was immediately visible—bright features, labeled cells, and fluorescent markers. But there’s so much more happening beneath the surface. scanR enables researchers to capture and analyze millions of cells, providing a comprehensive view of biological variability, not just a few representative images.
Additionally, the scanR system can identify subcellular structures, cellular phenotypes, or dynamic behaviors that would otherwise be too subtle to see or too complex to measure. That’s why researchers can explore new scientific questions that were previously out of reach.
It’s not just about raw data—it’s about unlocking insights that weren’t previously accessible. That’s the real power of scanR: it illuminates the unseen and equips researchers with the tools to make those discoveries.
Q: Can you share an example of how this plays out in real research?
Dr. Veiga: Absolutely. For example, two images next to each other, containing thousands of cells each, may look very similar to the human eye. However, when the cells are classified and plotted in multidimensional histograms, the differences in the samples become obvious from the histograms.
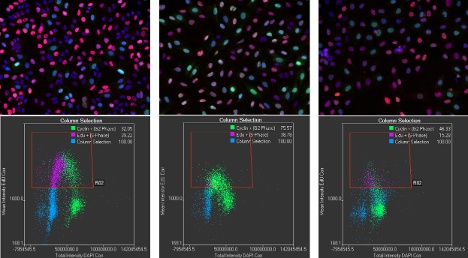
The image on the left (control) is clearly different from the other two (there are brighter and more abundant pink cells). However, the differences between the two images on the right are not so obvious. 2D histogram plots of intensity values of the different fluorescence marks clearly reveal different percentages of cell populations in all three images.
As scanR can analyze data in parallel to the acquisition, this means we can take a deep dive into customers’ samples during demonstrations. Researchers who are used to lower imaging throughput and lower cell statistics are sometimes surprised when looking at the 2D histograms, because they find phenotypes they were not expecting.
These may happen at a very low percentage but are readily visible as outliers in the 2D histograms. Despite their low percentage, if reproducible, they may have biological relevance. The users can directly click in the 2D histograms and see the cells behind any data point, so they have full control of the experiment and can start to explore new scientific questions.
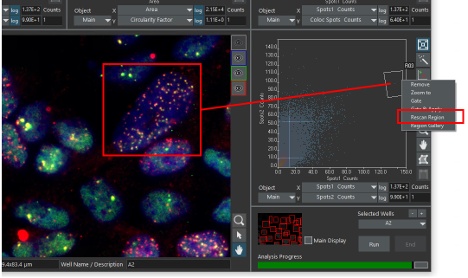
A cell with an abnormal number of spots is easily identified as an outlier in a 2D histogram. The cell can be reimaged at higher magnification (or even by changing from widefield to confocal) by using the Rescan Region function.
Accomplishing the Things That Matter: Serving Real-World Needs
Q: How does scanR version 3.6 make a difference in terms of real-world usability?
Dr. Veiga: In the real world, time, resources, and flexibility are all limited, so it’s essential that scanR 3.6 works within those constraints. We designed scanR to be modular, enabling labs to start with a basic setup and scale up as their needs evolve—whether that means adding AI capabilities, live-cell incubation, cell tracking analysis, or super-resolution imaging. Furthermore, scanR and cellSens™ software can both coexist on the same microscope, expanding the system’s flexibility. It’s about providing a system that grows with the needs of the lab, without adding unnecessary complexity.
From the analysis software side, I am delighted to experience how cleverly scanR was designed from its first release. Throughout the years, its structure has enabled us to seamlessly integrate new features into the analysis toolset, such as image processing, object hierarchy, cell tracking, and AI-powered segmentation. Raw data is never modified, and multiple analyses can run in the same dataset without the need to duplicate the images. One or more AI models can be used in one or more channels in a complete Z-stack or in a single Z-layer. AI probabilities can be inspected for quality control, and so on. From my perspective, it is the perfect interface for AI-powered analysis and assay development. And it is fun to work with—by far the most enjoyable research tool I have worked with in my career!
Moreover, imaging facility managers have shared that scanR coupled with cellSens software quickly became their most-used microscope solution in terms of time spent on the system, even surpassing confocal microscopes. The results they’re obtaining are the real measure of success.3
Q: Finally, what excites you most about the future of scanR and Evident’s role in life sciences?
Dr. Veiga: Personally, what excites me the most is realizing that scanR users are not only our customers but our close collaborators. Their feedback on the systems helps us improve it every year, and we adapt it to their scientific needs as much as we can. Additionally, scanR goes beyond imaging to analysis, and we provide support for setting up analysis assays that give us insights into their research and the latest trends in microscopy. From a company point of view, scanR is a great asset to keep us updated in science.
Finally, at Evident, we are not just building cutting-edge microscopy solutions—we are contributing to the future of science. And I believe that scanR is at the heart of that future. Our mission is to empower researchers. We want every scientist to have access to the best imaging tools, no matter their lab’s size or their research questions.
About the Interviewee

Manoel Veiga earned his PhD in physical chemistry at the University of Santiago de Compostela, Spain. Following two postdocs at the Complutense University of Madrid and University of Münster, he worked to support professionals worldwide in the fields of fluorescence lifetime imaging microscopy (FLIM) and time-resolved spectroscopy. He brought his experience to the EVIDENT Technology Center Europe in 2017, where he works as a global application specialist with a focus on high-content analysis and deep learning.
References
- Toledo, L.I., M. Altmeyer, M.B. Rask, C. Lukas, D.H. Larsen, L.K. Povlsen, S. Bekker-Jensen, N. Mailand, J. Bartek, and J. Lukas. 2013. "ATR Prohibits Replication Catastrophe by Preventing Global Exhaustion of RPA." Cell 155 (5): 1088–103.
Michelena, J., A. Lezaja, F. Teloni, T. Schmid, R. Imhof, and M. Altmeyer. 2018. "Analysis of PARP Inhibitor Toxicity by Multidimensional Fluorescence Microscopy Reveals Mechanisms of Sensitivity and Resistance." Nature Communications 9 (1): 2678.
Zonderland, G., R. Vanzo, S.A. Gadi, E. Martín-Doncel, F. Coscia, A. Mund, M. Lerdrup, J. Benada, D. Boos, and L. Toledo. 2022. "The TRESLIN-MTBP Complex Couples Completion of DNA Replication with S/G2 Transition." Molecular Cell 82 (18): 3350–65.e7. - Fagherazzi, Paolo, Timo Diekmann, Alessandra Ardizzoia, Zuzana Machacova, Simran Negi, Anoop Kumar Yadav, Pavel Moudry, Vincenzo Costanzo, and Hana Polasek-Sedlackova. 2025. "Quantitative AI-Based DNA Fiber Workflow to Study Replication Stress." bioRxiv.
- Veiga, Manoel. 2022. "Multimodal Solution Supports Whole Slide Scanning and High-Content Screening in Neuroscience." EvidentScientific.com. Accessed July 24, 2025.
Related Content
10 Key Improvements in TruAI Technology Advancing Life Science Image Analysis
20 Examples of Effortless Nucleus and Cell Segmentation Using Pretrained Deep-Learning Models
Instance Segmentation of Cells and Nuclei Made Simple Using Deep Learning