Fluorescent Probe Excitation Efficiency
Fluorescent Probe Excitation Efficiency - Java Tutorial
The absorption and fluorescence emission spectral profiles of a fluorophore are two of the most important criteria that must be scrutinized when selecting probes for applications in laser scanning confocal microscopy. In addition to the wavelength range of the absorption and emission bands, the molar extinction coefficient for absorption and the quantum yield for fluorescence emission should be considered. At laser excitation levels that do not saturate the fluorophore, fluorescence intensity is directly proportional to the product of the extinction coefficient and the quantum yield. This interactive tutorial examines how this relationship can be utilized to match fluorophores with specific lasers for confocal microscopy.
The tutorial initializes with a spectral wavelength versus relative intensity plot appearing in the window, and the absorption and fluorescence emission spectral profiles for a randomly selected fluorophore displayed on the graph. Superimposed over the fluorophore excitation spectrum is the closest common confocal laser spectral line to the center of the dye absorption maximum. At this wavelength, fluorescence emission is theoretically nearest the maximum value possible with the laser, and the fluorophore emission curve in the tutorial contains a fill indicative of the color spectrum at the intensity level permitted by the product of the fluorophore extinction coefficient and the emission intensity. The Emission Intensity box in the lower left-hand corner of the window presents the color most closely associated with fluorescence emission at the maximum wavelength.
In order to operate the tutorial, use the Wavelength slider to adjust the laser selection over a region dictated by the absorption spectral profile of the fluorophore. The slider is limited in a range by the ends of the spectra, and can only travel to the closest laser line past these boundaries. As the virtual laser line is translated along the wavelength axis, the tutorial calculates the product of the fluorophore molar extinction coefficient and fluorescence quantum yield and continuously updates the resulting value as a percentage beneath the Emission Intensity box to provide a qualitative measure of the relative fluorescence emission that can be expected at the corresponding excitation wavelength. Likewise, the intensity of the color displayed in the Emission Intensity box changes to reflect the relative intensity of fluorescence emission at the chosen laser source excitation wavelength. The laser source associated with each wavelength is displayed in a yellow box above the Wavelength slider, and the specific spectral line from that laser is displayed above the slider bar. Fluorophore classes can be selected using the radio buttons on the right-hand side of the window, and individual fluorophores can be loaded into the display graph using the Choose A Dye pull-down menu.
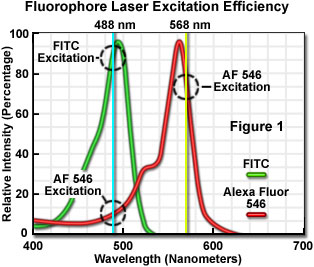
The number of fluorescent probes currently available for confocal microscopy runs in the hundreds, with many dyes having absorption maxima closely associated with common laser spectral lines. An exact match between a particular laser line and the absorption maximum of a specific probe is not always possible, but the excitation efficiency of lines near the maximum is usually sufficient to produce a level of fluorescence emission that can be readily detected. For example, in Figure 1 the absorption spectra of two common probes are illustrated, along with the most efficient laser excitation lines. The green spectrum is the absorption profile of fluorescein isothiocyanate (FITC), which has an absorption maximum of 495 nanometers. Excitation of the FITC fluorophore at 488 nanometers using an argon-ion laser produces an emission efficiency of approximately 87 percent. In contrast, when the 477-nanometer or the 514-nanometer argon-ion laser lines are used to excite FITC, the emission efficiency drops to only 58 or 28 percent, respectively. Clearly, the 488-nanometer argon-ion (or krypton-argon) laser line is the most efficient source for excitation of this fluorophore.

The red spectrum in Figure 1 is the absorption profile of Alexa Fluor 546, a bi-sulfonated alicyclic xanthene (rhodamine) derivative with a maximum extinction coefficient at 556 nanometers, which is designed specifically to display increased quantum efficiency at significantly reduced levels of photobleaching in fluorescence experiments. The most efficient laser excitation spectral line for Alexa Fluor 546 is the yellow 568-nanometer line from the krypton-argon mixed gas ion laser, which produces an emission efficiency of approximately 84 percent. The next closest laser spectral lines, the 543-nanometer line from the green helium-neon laser and the 594-nanometer lines from the yellow helium-neon laser, excite Alexa Fluor 546 with an efficiency of 43 and 4 percent, respectively. Note that the 488-nanometer argon-ion laser spectral line excites Alexa Fluor 546 with approximately 7-percent efficiency, a factor that can be of concern when conducting dual labeling experiments with FITC and Alexa Fluor 546 simultaneously.
对不起,此内容在您的国家不适用。